« Organismo Andino de Salud desarrollará acciones en cuatro áreas prioritarias | Home | Trash Photos IV: The Carioca Model »
“Up in Smoke” PostScript: Related Materials on Climate Change and LAC
By Keith R | September 30, 2006
Topics: Climate Change, Energy & the Environment, Environmental Protection | No Comments »

 (No Ratings Yet)
It’s been suggested to me to post some recommendations for follow-up reading and resources related to the review I did on the “Up in Smoke” report on probable impact of global climate change on Latin America and the Caribbean (LAC).
I’m a bit hesitant to do so because
- I don’t consider myself to be an authority on the subject, or even fully briefed — I, like so many others, am still in the process of getting better educated on this critical issue;
- there is already a ton of information, some of it quite good, all sorted in nearly every way imaginable, already circulating on the internet;
- there’s doubtless many good items I’ve yet to find and evaluate, so anything I post here likely will be quite incomplete.
But if you, dear reader, keep in mind and tolerate these provisos, I’ll take an initial stab at it. if you know of other good, solid resources not mentioned here, please let me know and I’ll add them. Likewise, as I come across more resources, I’ll share them here.
Best One-Stop Portals for Climate Change Information
I’m sure there are others, but I very much like the job Calvin Jones has done with Climate Change News and Climate Change Resources. Although they are not sites specializing in how the issue relates to LAC nations (I have yet to find such a site), they are at least an excellent starting point for anyone seeking a broad range of online resources regarding the issue of global climate change.

 The “Hotmaps”
I was alerted to this resource too late to work it into my post about the “Up in Smoke” report.
The images thumbnailed to the right are two of several “hotmaps” prepared in 1999 and updated in 2003 by a group of nongovernmental organizations (NGOs)* to show graphically the “fingerprints” and “harbingers” of global climate change. Click on these thumbnails to go directly to the webpages for each.
As the maps’ makers define them, “fingerprints” (the orange tags on the map) are “direct manifestations” of the trend. “Harbingers” are events that foreshadow the types of impacts from global climate change we can expect more of in the future.
I’m not certain all of these items can be attributable completely or even principally to global climate change, but then again, I’m not a climatologist. The maps do provide a good feel, though, for the potential variety and spread of climate change impacts in LAC nations.
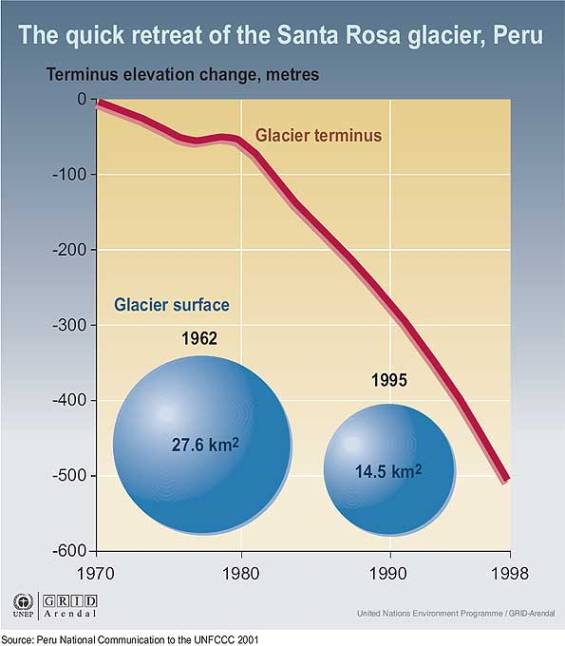
The Melting Glaciers of the Andes

The following are pictures of the San Quintin glacier in Patagonia (also diagramed above) were taken eight years apart by the space shuttle and provided by NASA:


(click on the 2 graphics below to see them full size)

LAC Ratification of the Kyoto Protocol
Of the LAC nations, all but Suriname and St. Kitts and Nevis have ratified the Kyoto Protocol. If you wish to know the official ratification dates of LAC nations, check the latest Temas ratification status chart PDF at this link.
Climate Change Communications and Inventories
Most of the LAC nations have submitted their First National Communication to the secretariat of the United Nations Framework Convention on Climate Change (UNFCCC). A few (such as Uruguay) have even submitted their second. The full listing of direct links to these documents, whether in English, Spanish or Portuguese, can be found in a PDF with clickable links in the Temas tools section at this link. I’ll be discussing a few of these Communications, and national strategies to address global climate change, in future Temas blog entries.
How Seriously Does the LAC Public Regard Climate Change?
This is a bar graph published by the BBC summarizing the results of a Globescan survey conducted at the end of 2005:

Some Graphics Showing How LAC Fits Into the Global Climate Change Picture
The following are all from the UN Environment Programme’s (UNEP) GRID website.

 Some Impacts. The graphic on the right (click to see full-size) shows recent shifts in surface temperatures in LAC nations. The one on the left (click to see full size) shows what the Intergovernmental Panel on Climate Change’s (IPPC) two primary climate change models (of six models examined) predict for changes in precipitation patterns in “tropical America” (essentially Latin America) over the course of the 21st century. The “A2” scenario assumes focusing mainly on economic growth rather than addressing climate change head-on; “B2” is one where the world focusses fully on environmental sustainability.
Generally speaking, areas currently prone to get large doses of rainfall will get more, those in recent decades facing declines will get even drier.
 Carbon Dioxide Emissions. Although LAC only accounted for 5.5% of the global CO2 emissions in 2000 (click on graph at left to see it full size), the region accounted for 30% of the world’s CO2 emissions attributable to land use and forestry changes (i.e., deforestation).

The above graphic shocks most people. Most don’t expect LAC to have several nations above the global average for CO2 emissions, much less that Bahamas’ CO2 emissions would match those of France, Barbados’ to exceed those of France and Trinidad and Tobago’s nearly match those of the US (three guesses which industry in T&T contributes the lion’s share of those CO2 emissions, and first two guesses do not count!).
 Among the CO2 emissions linked to fossil fuels in LAC, the largest share (38%), regionally speaking, belongs to transport emissions. For the countries shown here on the right (click on thumbnail to see bar graph full size), the percentage is much greater, so any policy attempt to deal with their contribution to global climate change would have to address emissions from the transport sector. During the 1990s the increase in CO2 emissions from transport in South America was higher than the world average, while the increase in Central America and the Caribbean was similar to world average.

 Methane Emissions. While per capita methane (CH4) emissions of Central America and the Caribbean are more or less in line with the world average, those of South America are nearly twice the world average (click on graphics to see them full size). Most of these methane emissions are believed to be traceable to burning fossil fuels, rice paddies, waste dumps and livestock. According to the IPCC, methane has a global warming potential 23 times that of CO2. As this graphic makes clear, addressing its methane emissions should be a major portion of Brazil’s strategy to reduce its impact on global climate change.
 Nitrous Oxide Emissions. N2O has a global warming potential 296 times greater than CO2. While N2O emissions in Central America are half that of the world average, those in N2O in South America (especially Brazil) are twice the world average. Most N2O emissions come from fertilizers and industrial combustion.
 Large Hydroelectric Projects: Part of the Solution or Part of the Problem? Many people, when proposing steps nations can take to address climate change, propose the greater use of renewable energy sources, without discriminating among such sources. But some studies suggest this might be foolish, especially if it leads to (as it likely would in South America) to more large hydropower projects in tropical zones. Submerging large land areas and its tropical vegetation, plus the resulting fluctuation in water levels, set in motion physio-chemical processes that decompose organic matter and generate large quantities of methane and CO2.
These graphics compare the potential greenhouse gas emissions of the Tucuru and Balbina dam projects in the Amazon versus those that would result from natural gas combined-cycle plants of similar capacity.
* Environmental Defense, Natural Resources Defense Council (NRDC), Sierra Club, Union of Concerned Scientists (UCS), US Public Interest Research Groups (USPIRG), World Resources Institute (WRI), World Wildlife Fund (WWF)
— Keith R
Tags: Andes, Balbina, Barbados, BBC, Brasil, Brazil, cambio climático, carbon dioxide, Caribbean, Central America, centrales hidroeléctricas, CH4, Climate Change, CO2, Cordillera Blanca, energía renovable, energia renovável, Environmental Defense, fertilizantes, fertilizers, fossil fuels, France, glaciers, Globescan, hotmaps, hydroelectric, IPCC, Kyoto Protocol, livestock, metano, methane, mudanças climáticas, N2O, NASA, nitrous oxide, NRDC, Patagonia, Peru, PNUMA, Protocolo de Kyoto, renewable energy, rice paddies, San Quintin glacier, Santa Rosa glacier, Sierra Club, South America, St. Kitts and Nevis, Suriname, transport, Trinidad and Tobago, Tucuru, UCS, UNEP, UNFCCC, Uruguay, USPIRG, waste dumps, WRI, WWF, Yanapaccha
 Subscribe to My Comments Feed