« Toward a National Waste Exchange for Brazil | Home | More Glass Packaging Recovery, Less Piracy? »
Gas Flaring, LAC & Climate Change
By Keith R | October 4, 2007
Topics: Climate Change, Energy & the Environment, Environmental Protection, Extractive Sectors | No Comments »

 (No Ratings Yet)
")
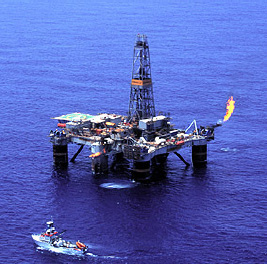 Take a look at the two images to the right. The first is of an offshore platform flaring gas. The second (click to enlarge) is a computer-enhanced satellite photo of gas flaring off the coast of Trinidad and Tobago. Yes, if you use the right technique, you now can document flaring from space.
Why is that significant? It means that we now have some tools by which we can double-check the flaring figures provided by government and energy companies, and fill in data gaps where such information was not even being offered (at least not in updated figures).
Why care at all about gas flaring? First off, it’s a waste: the equivalent of 5.5% of the world’s natural gas production is burned off every year, in an age where we can ill-afford to waste energy. Second, the flaring produces air pollution (soot, carbon monoxide) and contributes substantially to global climate change: globally flaring emits about 400 million tons of carbon dioxide (CO2) emissions every year.
 The satellite analysis of some 60 nations is presented in a report commissioned by the World Bank’s Global Gas Flaring Reduction partnership (GGFR), the alliance launched by the Bank and Norway at the World Summit on Sustainable Development (WSSD – “Rio+10”) in 2002. While the GGFR includes 14 oil-producing nations nations and 10 oil & gas multinationals, you might note from this map (click to enlarge) most of the key players from Latin America and the Caribbean (LAC) are not members — namely, Brazil, Mexico and Venezuela. [Temas Observation: how do Brazil and Mexico justify all their rhetoric about acting responsibility regarding climate change, yet stay apart from this initiative? How do their state-owned enterprises that dominate the hydrocarbon markets in their respective countries, Petrobras and PEMEX, justify all their rhetoric about “corporate social and environmental responsibility” and yet not participate separately along with their industry brothers, BP, Chevron, ExxonMobil, Shell, ENI, Total and Statoil?] But then, lesser LAC players such as Argentina, Bolivia, Colombia, Peru or Trinidad have not yet chosen to join either.
The satellite study was actually executed by scientists at the US National Oceanic and Atmospheric Administration (NOAA). The US is both donor and country member of GGFR.
The study produced some surprises. For example, prior to the satellite study, most experts thought Nigeria was the world’s biggest gas flaring culprit; the study showed that the dubious honor actually belongs to Russia (which flares more than twice what Nigeria does). The study also resulted in a major reshuffling of the list of the globe’s top 20 gas flaring nations.
But this is The Temas Blog, so let’s get to the true focus of this post: what does the study tell us about the LAC nations among the 60 nations studied? The thumbnails for the 1995-2006 flaring trend charts for 10 LAC nations are provided below — click each to enlarge and view.
The data shows that the LAC nations with steady drops in flaring are Argentina, Bolivia, Chile and Peru.
Although the World Bank’s press release says that both Ecuador and Trinidad and Tobago have had what they call “largely stable gas flaring” during the period examined by the study, I have a hard time reading Trinidad’s chart that way. I’m not a scientist, but it looks to me like Trinidad had made modest progress in decreasing flaring until 2004, but since then has spiked to almost match its prior record levels — how in the world does that qualify as “largely stable”???
The Bank’s press release is notably silent about Brazil, Colombia, Mexico and Venezuela. Perhaps that is because in each case the country had been making some progress in reducing flaring until recent years, but having been backsliding since.
")
")
")
")
")
")
")
")
")
")
______________________________
From the World Bank:
First Satellite Observations Of Gas Flaring Show Countries, Companies Need To Step Up Efforts
While 22 countries have actually increased gas flaring, 16 have made progress in reducing it, and nine have maintained stable levels of flaring over a 12-year period, according to the study
The first globally consistent survey of gas flaring has been conducted using satellite data, and a series of national and global estimates of gas flaring volumes have been produced covering a twelve-year period spanning 1995 through 2006.
The survey, which was commissioned and funded by the World Bank’s Global Gas Flaring Reduction partnership (GGFR), was executed by scientists at the US National Oceanic and Atmospheric Administration.
Gas flaring estimates, which were produced for sixty countries or areas around the world, show that global gas flaring has remained largely stable over the past twelve years, in the range of 150 to 170 BCM.
According to the satellite data, in 2006 oil producing countries and companies burned about 170 billion cubic meters (bcm) of natural gas worldwide or nearly five trillion cubic feet. That’s equivalent to 27% of total U.S. natural gas consumption and 5.5% of total global production of natural gas for the year. If the gas had been sold in the United States instead of being flared, the total US market value would have been about $40 billion. Gas flaring also emits some 400 million tons of carbon dioxide (CO2) emissions.
“Gas flaring not only harms the environment by contributing to global warming but is a huge waste of a cleaner source of energy that could be used to generate much needed electricity in poor countries around the world,” says Bent Svensson, manager of the Bank’s GGFR partnership. “In Africa alone about 40 billion cubic meters of gas are burned every year, which if put to use could generate half of the electricity needed in that continent.”
Flaring or burning of gas is widely used to dispose of natural gas liberated during oil production and processing when this occurs in remote areas far from potential users, where there is often no infrastructure on site to make use of the gas. In recent years, however, renewed efforts are being made to eliminate flaring, such as re-injecting it into the ground to boost oil production, converting it into liquefied natural gas for shipment, transporting it to markets via pipelines, or using it on site for generation of electricity.
“This study proves that it is possible to monitor gas flaring from space and make reasonable and independent estimates of the volume being wasted,” says Christopher Elvidge a scientist with NOAA’s National Geophysical Data Center (NGDC) and lead author of the study. “In the past, the only way to track gas flaring was through official estimates, but now those days are over. These independent figures should help governments and companies alike to get a better sense of how much gas they are actually flaring.”
Since this is the first study of gas flaring using satellite observations, scientists warn that these preliminary results should be used with caution, as there still are several sources of error and uncertainty, including variations in flare efficiency, mis-identification of flares, non-continuous sampling, and environmental effects.
According to the satellite observations, 22 countries have increased gas flaring over the past 12 years. These include: Azerbaijan, Chad, China, Equatorial Guinea, Ghana, Iraq, Kazakhstan, Kyrgyzstan, Mauritania, Myanmar, Oman, Philippines, Papua New Guinea, Qatar, Russia (excluding Khanty Mansiysk region), Saudi Arabia, South Africa, Sudan, Thailand, Turkmenistan, Uzbekistan, and Yemen.
On the other hand, the satellite observations show that 16 countries have decreased gas flaring from 1995 to 2006, including Algeria, Argentina, Bolivia, Cameroon, Chile, Egypt, India, Indonesia, Libya, Nigeria, North Sea, Norway, Peru, Syria, UAE and USA (offshore).
And nine countries have had largely stable gas flaring across those 12 years. These include Australia, Ecuador, Gabon, Iran, Kuwait, Malaysia, Khanty-Mansiysk (Russian Federation), Romania, and Trinidad.
The authors used low-light imaging data from the U.S. Air Force Defense Meteorological Satellite Program to assess the volumes of gas burned in flares, which are visible in observations of nighttime lights under cloud-free conditions. Current and planned satellite sensors will continue to provide data suitable for estimating gas flaring volumes for decades to come. GGFR encourages on-site monitoring as well to help track changes in gas flaring volumes and to report progress in reducing flaring.
______________________________
Desde el Banco Mundial:
Las primeras observaciones satelitales de la quema de gas revelan que los países y las empresas deben intensificar sus esfuerzos
Según el estudio, 22 países aumentaron su quema de gas, 16 lograron avances en su reducción y nueve mantuvieron niveles estables de quema de gas en un período de 12 años
El primer estudio coherente a nivel mundial de la quema de gas se realizó utilizando datos satelitales y produjo una serie de estimaciones nacionales y mundiales de los volúmenes de quema de gas que abarca un período de 12 años desde 1995 hasta 2006.
El estudio, que fue encargado y financiado por la Asociación para la reducción mundial de la quema de gas (GGFR, por sus siglas en inglés) del Banco Mundial, fue realizado por científicos de la Administración Nacional Oceánica y Atmosférica (NOAA, por sus siglas en inglés) de Estados Unidos.
Las estimaciones de quema de gas, que se realizaron para 60 países o regiones en todo el mundo, revelan que la quema de gas mundial se mantuvo considerablemente estable en los últimos 12 años, en el rango de 150.000 a 170.000 millones de metros cúbicos.
Según los datos satelitales, en 2006 las empresas y los países productores de petróleo quemaron alrededor de 170.000 millones de metros cúbicos de gas natural en todo el mundo, o cerca de cinco billones de pies cúbicos. Eso equivale al 27% del consumo total de gas natural de Estados Unidos y al 5,5% de la producción mundial total de gas natural en ese año. Si el gas se hubiera vendido en Estados Unidos en vez de quemarse, el valor total en el mercado estadounidense habría sido de aproximadamente US$40.000 millones. La quema de gas también emite alrededor de 400 millones de toneladas de dióxido de carbono (CO2).
Según Bent Svensson, director de la Asociación de GGFR del Banco,“La quema de gas no sólo perjudica al medio ambiente al contribuir al calentamiento global, sino que es un enorme desperdicio de una fuente de energía más limpia que podría utilizarse para generar la electricidad que tanto se necesita en los países pobres de todo el mundo. Sólo en África se queman alrededor de 40.000 millones de metros cúbicos de gas cada año que, de ser utilizados, podrían generar la mitad de la electricidad que se necesita en el continente”.
La quema de gas se utiliza frecuentemente para eliminar el gas natural que se libera durante la extracción y el procesamiento de petróleo crudo cuando estas actividades se llevan a cabo en áreas remotas, lejos de posibles usuarios, donde a menudo no existe infraestructura in situ para utilizar el gas. Sin embargo, en los últimos años, están realizándose nuevos esfuerzos para eliminar la quema, como reinyectar el gas en el yacimiento para facilitar la extracción de petróleo crudo, convertirlo en gas natural licuado que puede ser transportado, enviarlo a los mercados por medio de gasoductos o utilizarlo in situ para la generación de electricidad.
Christopher Elvidge, científico del Centro Nacional de Datos Geofísicos (NGDC, por sus siglas en inglés) de la NOAA y autor principal del estudio, sostiene que:“Este estudio demuestra que es posible supervisar la quema de gas desde el espacio y realizar estimaciones razonables e independientes del volumen que se desperdicia. En el pasado, la única forma de medir la quema de gas era usando estimaciones oficiales, pero ahora eso ha cambiado. Estas cifras independientes probablemente ayudarán a gobiernos y empresas por igual a tener una mejor idea de la cantidad de gas que queman”.
Dado que éste es el primer estudio de quema de gas que utiliza observaciones satelitales, los científicos advierten que estos resultados preliminares deberían utilizarse con cautela, ya que aún existen diversas fuentes de error e incertidumbre, como las variaciones en la eficiencia del sistema de quema, la identificación errónea de la quema, el muestreo discontinuo y los efectos ambientales.
De acuerdo con las observaciones satelitales, 22 países aumentaron su quema de gas en los últimos 12 años. Algunos de ellos son: Arabia Saudita, Azerbaiyán, Chad, China, Filipinas, Ghana, Guinea Ecuatorial, Irak, Kazajstán, Kirguistán, Mauritania, Myanmar, Omán, Papua Nueva Guinea, Qatar, Rusia (con excepción de la región de Khanty-Mansiysk ), Sudáfrica, Sudán, Tailandia, Turkmenistán, Uzbekistán y Yemen.
Por otro lado, las observaciones satelitales revelan que 16 países redujeron su quema de gas entre 1995 y 2006, entre ellos Argelia, Argentina, Bolivia, Camerún, Chile, Egipto, Emiratos Árabes Unidos, Estados Unidos (extraterritorial), India, Indonesia, Libia, Nigeria, el Mar del Norte, Noruega, Perú y Siria.
Por último, nueve países mantuvieron una quema de gas considerablemente estable en el período de 12 años. Entre ellos se encuentran Australia, Ecuador, Gabón, Irán, Khanty-Mansiysk (Federación Rusa), Kuwait, Malasia, Rumania y Trinidad y Tabago.
Los autores utilizaron datos de imágenes de luz baja del Programa de Satélite Meteorológico de Defensa de la Fuerza Aérea de Estados Unidos para analizar los volúmenes de gas quemado, que son visibles en las observaciones de luces nocturnas cuando el cielo se encuentra despejado de nubes. Los sensores satelitales que existen actualmente y que se construirán seguirán brindando datos adecuados para estimar los volúmenes de quema de gas durante décadas. La Asociación de GGFR también fomenta el control in situ para ayudar a medir los cambios de los volúmenes de quema de gas e informar sobre los avances en la reducción de la quema.
Tags: air pollution, Algeria, Argentina, Australia, Azerbaijan, Banco Mundial, Bolivia, BP, Brasil, Brazil, cambio climático, Cameroon, carbon dioxide, carbon monoxide, Chad, Chevron, China, Climate Change, CO2, Colombia, contaminación atmosférica, Ecuador, Egypt, ENI, Equatorial Guinea, ExxonMobil, Gabon, gas flaring, gas natural, gas natural licuado, gasoductos, Ghana, hidrocarbonetos, hydrocarbons, imágenes satelitales, India, Indonesia, Iran, Iraq, Kazakhstan, Kuwait, Kyrgyzstan, Libya, Malaysia, Mauritania, Myanmar, natural gas, Nigeria, NOAA, North Sea, Norway, Oman, Papua New Guinea, PEMEX, Peru, Petrobras, Philippines, Qatar, quema de gas, Rio+10, Romania, Russia, satellite imaging, satellite photos, Saudi Arabia, Shell, soot, South Africa, state-owned enterprises, Statoil, Sudan, Syria, Thailand, Trinidad and Tobago, Turkmenistan, U.S. Air Force, UAE, Uzbekistan, Venezuela, World Bank, WSSD, Yemen
 Subscribe to My Comments Feed